
Page 20 - 2024S
P. 20
UEC Int’l Mini-Conference No.52 13
3.2 Simulation Results
3.2.1 Operational Performance
The operational performance was measured by
the average delay experienced by vehicles. Delay
is defined as the difference between the current
travel time since a vehicle enters the incoming
lane of the intersection and the expected mini-
mum travel time of the lane. The proposed algo-
rithm reduced average delays by 9.1% compared
to FT and TAC.
Figure 1: Sumo intersection simulation.
3 Results
3.1 Simulation Settings
3.1.1 Intersection Geometry
The simulations were conducted in SUMO using
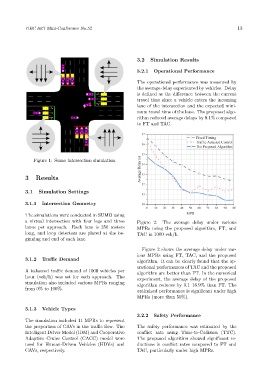
a virtual intersection with four legs and three Figure 2: The average delay under various
lanes per approach. Each lane is 250 meters MPRs using the proposed algorithm, FT, and
long, and loop detectors are placed at the be- TAC in 1000 veh/h.
ginning and end of each lane.
Figure 2 shows the average delay under var-
ious MPRs using FT, TAC, and the proposed
3.1.2 Traffic Demand algorithm. It can be clearly found that the op-
erational performances of TAC and the proposed
A balanced traffic demand of 1000 vehicles per algorithm are better than FT. In the numerical
hour (veh/h) was set for each approach. The
experiment, the average delay of the proposed
simulation also included various MPRs ranging algorithm reduces by 9.1–16.9% than FT. The
from 0% to 100%.
optimized performance is significant under high
MPRs (more than 50%).
3.1.3 Vehicle Types
3.2.2 Safety Performance
The simulation included 11 MPRs to represent
the proportion of CAVs in the traffic flow. The The safety performance was estimated by the
Intelligent Driver Model (IDM) and Cooperative conflict rate using Time-to-Collision (TTC).
Adaptive Cruise Control (CACC) model were The proposed algorithm showed significant re-
used for Human-Driven Vehicles (HDVs) and ductions in conflict rates compared to FT and
CAVs, respectively. TAC, particularly under high MPRs.