
Page 44 - 2024S
P. 44
UEC Int’l Mini-Conference No.52 37
Figure 6: Time plot by models
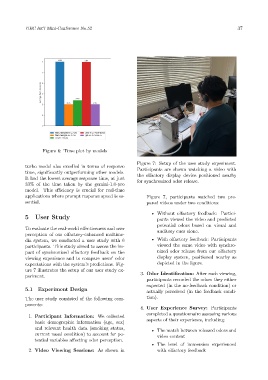
Figure 7: Setup of the user study experiment.
turbo model also excelled in terms of response
time, significantly outperforming other models. Participants are shown watching a video with
the olfactory display device positioned nearby
It had the lowest average response time, at just for synchronized odor release.
33% of the time taken by the gemini-1.0-pro
model. This efficiency is crucial for real-time
applications where prompt response speed is es- Figure 7, participants watched two pre-
sential. pared videos under two conditions:
• Without olfactory feedback: Partici-
5 User Study pants viewed the video and predicted
potential odors based on visual and
To evaluate the real-world effectiveness and user auditory cues alone.
perception of our olfactory-enhanced multime-
dia system, we conducted a user study with 6 • With olfactory feedback: Participants
participants. This study aimed to assess the im- viewed the same video with synchro-
pact of synchronized olfactory feedback on the nized odor release from our olfactory
viewing experience and to compare users’ odor display system, positioned nearby as
expectations with the system’s predictions. Fig- depicted in the figure.
ure 7 illustrates the setup of our user study ex-
periment. 3. Odor Identification: After each viewing,
participants recorded the odors they either
expected (in the no-feedback condition) or
5.1 Experiment Design actually perceived (in the feedback condi-
The user study consisted of the following com- tion).
ponents:
4. User Experience Survey: Participants
completed a questionnaire assessing various
1. Participant Information: We collected
basic demographic information (age, sex) aspects of their experience, including:
and relevant health data (smoking status, • The match between released odors and
current nasal condition) to account for po- video content
tential variables affecting odor perception.
• The level of immersion experienced
2. Video Viewing Sessions: As shown in with olfactory feedback