
Page 45 - 2024S
P. 45
38 UEC Int’l Mini-Conference No.52
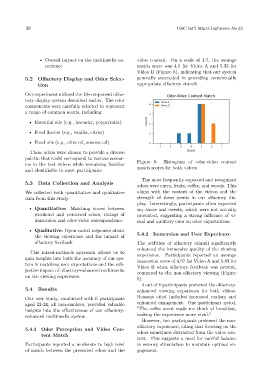
• Overall impact on the multimedia ex- video content. On a scale of 1-7, the average
perience match score was 4.5 for Video A and 5.33 for
Video B (Figure 8), indicating that our system
5.2 Olfactory Display and Odor Selec- generally succeeded in providing contextually
tion appropriate olfactory stimuli.
Our experiment utilized the 13-component olfac-
tory display system described earlier. The odor
components were carefully selected to represent
a range of common scents, including:
• Essential oils (e.g., lavender, peppermint)
• Food flavors (e.g., vanilla, citrus)
• Food oils (e.g., olive oil, sesame oil)
These odors were chosen to provide a diverse
palette that could correspond to various scenar-
ios in the test videos while remaining familiar Figure 8: Histogram of odor-video content
and identifiable to most participants. match scores for both videos
The most frequently expected and recognized
5.3 Data Collection and Analysis
odors were curry, fruits, coffee, and woods. This
We collected both quantitative and qualitative aligns with the content of the videos and the
data from this study: strength of these scents in our olfactory dis-
play. Interestingly, participants often expected
• Quantitative: Matching scores between soy sauce and sweets, which were not actually
predicted and perceived odors, ratings of presented, suggesting a strong influence of vi-
immersion and odor-video correspondence sual and auditory cues on odor expectations.
• Qualitative: Open-ended responses about
the viewing experience and the impact of 5.4.2 Immersion and User Experience
olfactory feedback The addition of olfactory stimuli significantly
enhanced the immersive quality of the viewing
This mixed-methods approach allows us to experience. Participants reported an average
gain insights into both the accuracy of our sys- immersion score of 4.67 for Video A and 5.83 for
tem in matching user expectations and the sub- Video B when olfactory feedback was present,
jective impact of olfactory-enhanced multimedia compared to the non-olfactory viewing (Figure
on the viewing experience.
9).
4 out of 6 participants preferred the olfactory-
5.4 Results enhanced viewing experience for both videos.
Our user study, conducted with 6 participants Reasons cited included increased realism and
aged 22-24, all non-smokers, provided valuable enhanced engagement. One participant noted,
insights into the effectiveness of our olfactory- ”The coffee scent made me think of breakfast,
enhanced multimedia system. making the experience more vivid.”
However, two participants preferred the non-
olfactory experience, citing that focusing on the
5.4.1 Odor Perception and Video Con-
tent Match odors sometimes distracted from the video con-
tent. This suggests a need for careful balance
Participants reported a moderate to high level in sensory stimulation to maintain optimal en-
of match between the presented odors and the gagement.