
Page 43 - 2025S
P. 43
36 UEC Int’l Mini-Conference No.54
Stiffness Histogram by SIMP #10 -16 Pareto: Mass vs Energy
800 1.2
1
700
0.8
600 Strain energy [J] 0.6
Number of elements 500 0.4
400
0.2
300
0 Max mass (0.164 kg)
200 0.158 0.159 0.16 0.161 0.162 0.163 0.164
Total Mass [kg]
100
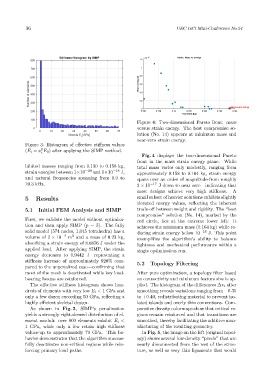
Figure 4: Two-dimensional Pareto front: mass
0 versus strain energy. The best compromise so-
0 10 20 30 40 50 60 70
Module E [GPa] lution (No. 14) appears at minimum mass and
i
near-zero strain energy.
Figure 3: Histogram of effective stiffness values
p
(E i = x E 0 ) after applying the SIMP method.
i
Fig. 4 displays the two-dimensional Pareto
front in the mass–strain energy plane. While
hibited masses ranging from 0.130 to 0.158 kg, total mass varies only modestly, ranging from
strain energies between 1×10 −20 and 1×10 −18 J, approximately 0.158 to 0.164 kg, strain energy
and natural frequencies spanning from 9.9 to spans over an order of magnitude-from roughly
10.3 kHz. 2 × 10 −17 J down to near zero—indicating that
most designs achieve very high stiffness. A
5 Results small subset of heavier solutions exhibits slightly
elevated energy values, reflecting the inherent
5.1 Initial FEM Analysis and SIMP trade-off between weight and rigidity. The “best
compromise” solution (No. 14), marked by the
First, we validate the model without optimiza- red circle, lies at the extreme lower left: it
tion and then apply SIMP (p = 3). The fully achieves the minimum mass (0.164 kg) while re-
solid model (574 nodes, 1,045 tetrahedra) has a ducing strain energy below 10 −18 J. This point
3
volume of 2 × 10 −4 m and a mass of 0.23 kg, exemplifies the algorithm’s ability to balance
absorbing a strain energy of 8.6876 J under the lightness and mechanical performance within a
applied load. After applying SIMP, the strain single optimization run.
energy decreases to 0.9442 J—representing a
stiffness increase of approximately 920% com-
5.2 Topology Filtering
pared to the unpenalized case—confirming that
most of the mesh is deactivated while key load- After pure optimization, a topology filter based
bearing beams are reinforced. on connectivity and minimum feature size is ap-
The effective stiffness histogram shows hun- plied. The histogram of the differences ∆x i after
dreds of elements with very low E i < 1 GPa and smoothing reveals variations ranging from −0.35
only a few dozen exceeding 50 GPa, reflecting a to +0.40, redistributing material to prevent iso-
highly efficient skeletal design. lated islands and overly thin connections. Com-
As shown in Fig. 3, SIMP’s penalization parative density colormaps show that critical re-
yields a strongly right-skewed distribution of el- gions remain reinforced and that transitions are
ement moduli: over 800 elements exhibit E i < smoothed, thereby facilitating the additive man-
1 GPa, while only a few retain high stiffness ufacturing of the resulting geometry.
values-up to approximately 70 GPa. This be- In Fig. 5, the image on the left (original topol-
havior demonstrates that the algorithm success- ogy) shows several low-density “pixels” that are
fully deactivates non-critical regions while rein- nearly disconnected from the rest of the struc-
forcing primary load paths. ture, as well as very thin ligaments that would