
Page 44 - 2025S
P. 44
UEC Int’l Mini-Conference No.54 37
#10 4 Pareto 2D: Mass vs Frequency
1.09
Max freq
1.08
Natural frequency [Hz] 1.07
1.06
(a) Original Topology (b) Smoothed Topology 1.05
1.04
Figure 5: Comparison of density colormaps be-
fore (left) and after (right) topology filtering, il- 1.03
0.169 0.17 0.171 0.172 0.173 0.174 0.175
lustrating how disconnected regions are removed Total Mass [Kg]
and feature sizes are smoothed.
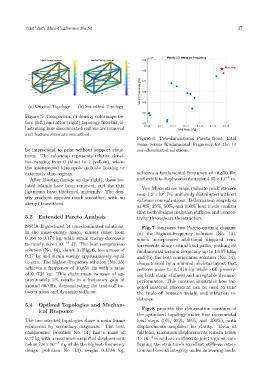
Figure 6: Two-dimensional Pareto front: total
mass versus fundamental frequency for the 14
be impractical to print without support struc- non-dominated solutions.
tures. The colormap represents relative densi-
ties ranging from 0 (blue) to 1 (yellow), where
the interspersed blue spots indicate floating or
extremely thin regions. achieves a fundamental frequency of 10,850 Hz,
After filtering (image on the right), these iso- and exhibits displacements under 4.95×10 −4 m.
lated islands have been removed, and the thin Von Mises stress maps indicate peak stresses
ligaments have thickened uniformly. The den- near 1.2×10 Pa, uniformly distributed without
7
sity gradient appears much smoother, with no extreme concentrations. Deformation snapshots
abrupt transitions.
at 0%, 25%, 50%, and 100% load levels confirm
that both designs maintain stiffness and connec-
5.3 Extended Pareto Analysis tivity throughout the structure.
NSGA-II produced 14 non-dominated solutions. Fig. 7 compares two Pareto-optimal designs:
In the mass–energy space, masses range from (a) the highest-frequency solution (No. 13),
0.166 to 0.174 kg, while strain energy decreases which incorporates additional diagonal rein-
to nearly zero (10 −14 J). The best compromise forcements along critical load paths, pushing its
solution (No. 14), shown in Fig. 6, has a mass of fundamental natural frequency up to 10.97 kHz;
0.17 kg and strain energy approximately equal and (b) the best compromise solution (No. 14),
to zero. The highest-frequency solution (No. 13) characterized by a minimal, skeletal layout that
achieves a frequency of 10,850 Hz with a mass reduces mass to 0.1418 kg while still preserv-
of 0.1734 kg. This slight mass increase of ap- ing both static stiffness and acceptable dynamic
proximately 2% results in a frequency gain of performance. This contrast illustrates how tar-
around 600 Hz, demonstrating the trade-off be- geted material placement can be used to tune
tween mass and dynamic stiffness. the trade-off between weight and vibration re-
sistance.
5.4 Optimal Topologies and Mechan-
ical Response Fig. 8 presents the deformation contours of
the optimized topology under four incremental
The two selected topologies share a main frame load steps (0%, 25%, 50%, and 100%), with
reinforced by secondary diagonals. The best displacements amplified for clarity. Even at
compromise (solution No. 14) has a mass of full load, maximum displacements remain below
0.17 kg with a maximum amplified displacement 1×10 −3 m and are confined to joint regions, con-
below 7.8×10 −4 m, while the highest-frequency firming the structure’s excellent stiffness reten-
design (solution No. 13) weighs 0.1734 kg, tion and overall integrity under increasing loads.