Page 34 - 2025S
P. 34

UEC Int’l Mini-Conference No.54                                                               27


                        Table 1: Comparison of Dynamic Multi-objective Optimization Techniques

             Method               HV Performance    Change Response   Implementation   Key Limitations

             Standard DNSGA-          Medium              Slow            Simple       Fixed parameters
             II [3]
             Memory-based [6]         Medium            Medium           Moderate      Archive   manage-
                                                                                       ment
             Prediction-based [7]       High              Fast           Complex       Training overhead
             Random       Immi-         Low               Fast            Simple       Convergence disrup-
             grants [5]                                                                tion
             Proposed                  High               Fast          Moderate       Computational
                                                                                       cost


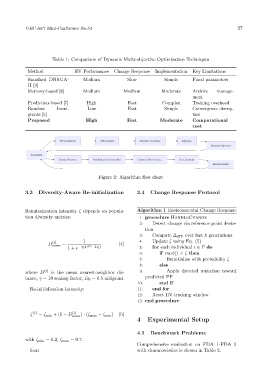
                                             Figure 2: Algorithm flow chart


            3.3   Diversity-Aware Re-initialization           3.4   Change Response Protocol


            Reinitialization intensity ζ depends on popula-   Algorithm 1 Environmental Change Response
            tion diversity metrics:                            1: procedure HandleChange
                                                               2:    Detect change via reference point devia-
                                                                 tion
                                                               3:    Compute ∆ HV over last k generations
                                      1                        4:    Update ζ using Eq. (5)
                        (t)
                      D norm  =                       (4)
                               1 + e −γ(D (t) −D 0 )           5:    for each individual i ∈ P do
                                                               6:       if rand() < ζ then
                                                               7:          Reinitialize with probability ζ
                                                               8:       else
            where D  (t)  is the mean nearest-neighbor dis-    9:          Apply directed mutation toward
            tance, γ = 10 scaling factor, D 0 = 0.5 midpoint.    predicted PF
                                                              10:       end if
              Re-initialization intensity:                    11:    end for
                                                              12:    Reset HV tracking window
                                                              13: end procedure

               ζ (t)  = ζ min + (1 − D (t)  ) · (ζ max − ζ min )  (5)
                                 norm
                                                              4    Experimental Setup


                                                              4.1   Benchmark Problems
            with ζ min = 0.2, ζ max = 0.7.
                                                              Comprehensive evaluation on FDA 1-FDA 5
              float                                           with characteristics is shown in Table 2.
   29   30   31   32   33   34   35   36   37   38   39