
Page 35 - 2025S
P. 35
28 UEC Int’l Mini-Conference No.54
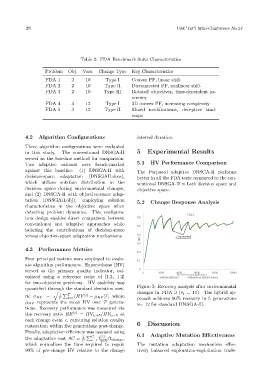
Table 2: FDA Benchmark Suite Characteristics
Problem Obj. Vars. Change Type Key Characteristics
FDA 1 2 10 Type I Convex PF, linear shift
FDA 2 2 10 Type II Disconnected PF, nonlinear shift
FDA 3 2 10 Type III Rotated objectives, time-dependent ge-
ometry
FDA 4 3 12 Type I 3D convex PF, increasing complexity
FDA 5 3 12 Type II Mixed modifications, deceptive land-
scape
4.2 Algorithm Configurations interval duration.
Three algorithm configurations were evaluated
in this study. The conventional DNSGA-II 5 Experimental Results
served as the baseline method for comparison.
Two adaptive variants were bench-marked 5.1 HV Performance Comparison
against this baseline: (1) DNSGA-II with The Porposed adaptive DNSGA-II performs
decision-space adaptation (DNSGAII.decs), better in all the FDA tests compared to the con-
which utilizes solution distribution in the ventional DNSGA-II in both decision space and
decision space during environmental changes, objective space.
and (2) DNSGA-II with objective-space adap-
tation (DNSGAII.obj), employing solution 5.2 Change Response Analysis
characteristics in the objective space when
detecting problem dynamics. This configura-
tion design enables direct comparison between
conventional and adaptive approaches while
isolating the contributions of decision-space
versus objective-space adaptation mechanisms
4.3 Performance Metrics
Four principal metrics were employed to evalu-
ate algorithm performance. Hypervolume (HV)
served as the primary quality indicator, cal-
culated using a reference point of [1.2, 1.2]
for two-objective problems. HV stability was
Figure 3: Recovery analysis after environmental
quantified through the standard deviation met-
q P changes in FDA 3 (τ t = 10). The hybrid ap-
2
ric σ HV = 1 T (HV (t) − µ HV ) , where
T t=1 proach achieves 90% recovery in 5 generations
µ HV represents the mean HV over T genera-
vs. 12 for standard DNSGA-II.
tions. Recovery performance was measured via
the recovery ratio RR (c) = HV t c+5 /HV t c−5 at
each change event c, capturing solution quality
restoration within five generations post-change. 6 Discussion
Finally, adaptation efficiency was assessed using 6.1 Adaptive Mutation Effectiveness
the adaptation cost AC = 1 P C t (c) /t change ,
C c=1 90%
which normalizes the time required to regain The mutation adaptation mechanism effec-
90% of pre-change HV relative to the change tively balanced exploration-exploitation trade-