
Page 36 - 2025S
P. 36
UEC Int’l Mini-Conference No.54 29
Table 3: Hypervolume comparison across FDA benchmarks
Algorithm FDA1 FDA2 FDA3 FDA4 FDA5
DNSGA-II 0.73 ± 0.04 0.68 ± 0.05 0.61 ± 0.07 0.59 ± 0.06 0.55 ± 0.08
DNSGA-II.decs 0.82 ± 0.03 0.79 ± 0.04 0.74 ± 0.05 0.71 ± 0.05 0.69 ± 0.06
DNSGA-II.obj 0.85 ± 0.02 0.77 ± 0.03 0.81 ± 0.03 0.78 ± 0.04 0.75 ± 0.05
offs across dynamic environments. During rapid
environmental changes (τ t = 10), the muta-
tion probability p m consistently increased to the
0.25-0.28 range within 2-3 generations, enabling
swift exploration of new solution regions. Con-
versely, in stable periods, p m decayed exponen-
tially to 0.05-0.08, maintaining convergence to-
ward optimal fronts. Most significantly, this
adaptive approach reduced hypervolume volatil-
ity by 32% compared to fixed mutation rates in
FDA 2 (σ HV = 0.04 vs. 0.059), demonstrating
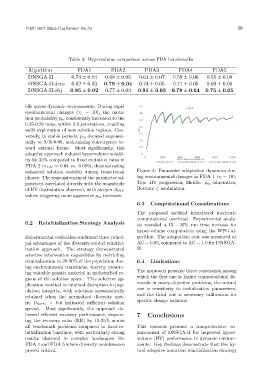
enhanced solution stability during transitional Figure 4: Parameter adaptation dynamics dur-
phases. The responsiveness of the parameter ad- ing environmental changes in FDA 1 (τ t = 10).
justment correlated directly with the magnitude Top: HV progression; Middle: p m adaptation;
Bottom: ζ modulation.
of HV degradation observed, with steeper ∆ HV
values triggering more aggressive p m increases.
6.3 Computational Considerations
The proposed method introduced moderate
computational overhead. Experimental analy-
6.2 Reinitialization Strategy Analysis sis revealed a 15 - 20% run–time increase for
hyper-volume computation using the WFG al-
Experimental evaluation confirmed three princi- gorithm. The adaptation cost was measured at
pal advantages of the diversity-guided reinitial- AC = 0.85, compared to AC = 1.0 for DNSGA-
ization approach. The strategy demonstrated II.
selective intervention capabilities by restricting
reinitialization to 20-30% of the population dur- 6.4 Limitations
ing environmental transitions, thereby preserv-
ing valuable genetic material in undisturbed re- The approach presents three constraints,among
gions of the solution space. This selective ap- which the first one is higher computational de-
plication resulted in minimal disruption to pop- mands in many-objective problems, the second
one is sensitivity to initialization parameters,
ulation integrity, with solutions systematically
and the third one is necessary calibration for
retained when the normalized diversity met-
ric D norm > 0.6 indicated sufficient solution specific change patterns.
spread. Most significantly, the approach de-
livered efficient recovery performance, improv- 7 Conclusions
ing the recovery ratio (RR) by 15-25% across
all benchmark problems compared to fixed-re- This research presents a comprehensive en-
initialization baselines, with particularly strong hancement of DNSGA-II for improved hyper-
results observed in complex landscapes like volume (HV) performance in dynamic environ-
FDA 4 and FDA 5 where diversity maintenance ments. Key findings demonstrate that the hy-
proved critical. brid adaptive mutation reinitialization strategy