
Page 13 - 2024F
P. 13
6 UEC Int’l Mini-Conference No.53
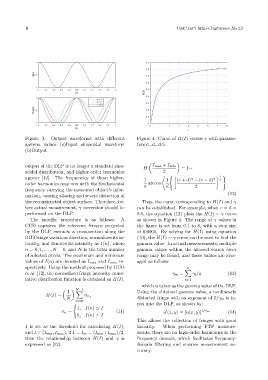
Figure 3: Output waveforms with different Figure 4: Curve of H(I) versus γ with parame-
gamma values (a)Input sinusoidal waveform ters c=d=0.5.
(b)Output
output of the DLP is no longer a standard sinu- I max + I min
H = 1−
soidal distribution, and higher-order harmonics 2
appear [12]. The frequencies of these higher- * ( γ γ 1 )
1 1 (c + d) − (c − d) γ
order harmonics may mix with the fundamental π arccos d 2
frequency carrying the measured object’s infor-
mation, causing aliasing and severe distortion of (12)
the reconstructed object surface. Therefore, be- Thus, the curve corresponding to H(I) and γ
fore actual measurement, γ correction should be can be established. For example, when c = d =
performed on the DLP. 0.5, the equation (12) plots the H(I) ∼ γ curve
The specific procedure is as follows: A as shown in Figure 4. The range of γ values in
CCD captures the reference fringes projected the figure is set from 0.1 to 8, with a step size
by the DLP, extracts a cross-section along the of 0.0001. By solving for H(I) using equation
fGUOringe variation direction, normalizes its in- (10), the H(I) ∼ γ curve can be used to find the
tensity, and denotes its intensity as I(n), where gamma value. In actual measurements, multiple
n = 0, 1, . . . , N − 1, and N is the total number gamma values within the allowed search error
of selected pixels. The maximum and minimum range may be found, and these values are aver-
values of I(n) are denoted as I max and I min , re- aged as follows:
spectively. Using the method proposed by GUO q
X
et al. [12], the normalized fringe intensity cumu- γ m = γ i /q (13)
lative distribution function is obtained as H(I). i=1
which is taken as the gamma value of the DLP.
N−1
1 X Using the obtained gamma value, a nonlinearly
H(I) = σ n ,
N distorted fringe with an exponent of 1/γ m is in-
n=0
( put into the DLP, as shown by:
1, I(n) ≤ I
σ n = (11) u (x, y) = [u(x, y)] 1/γ m (14)
′
0, I(n) > I
This allows the collection of fringes with good
I is set as the threshold for calculating H(I), linearity. When performing FTP measure-
and I ∈ (I min , I max ); if I = I m = (I min +I max )/2, ments, there are no high-order harmonics in the
then the relationship between H(I) and γ is frequency domain, which facilitates frequency-
expressed as [12]: domain filtering and ensures measurement ac-
curacy.