
Page 14 - 2024F
P. 14
UEC Int’l Mini-Conference No.53 7
3 Results
3.1 Matlab simulation
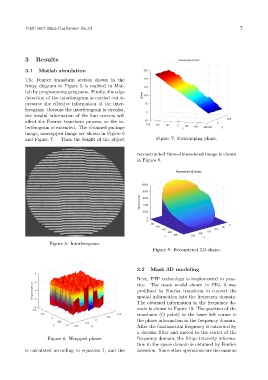
The Fourier transform section shown in the
fringe diagram in Figure 5 is realized in Mat-
lab by programming programs. Firstly, the edge
detection of the interferogram is carried out to
preserve the effective information of the inter-
ferogram. Because the interferogram is circular,
the invalid information of the four corners will
affect the Fourier transform process, so the in-
terferogram is extended. The obtained package
image, unwrapped image are shown in Figure 6
and Figure 7. Then the height of the object Figure 7: Unwrapping phase.
reconstructed three-dimensional image is shown
in Figure 8.
Figure 5: Interferogram.
Figure 8: Reconstruct 3D shape.
3.2 Mask 3D modeling
Next, FTP technology is implemented in prac-
tice. The mask model shown in FIG. 9 was
profilized by Fourier transform to convert the
spatial information into the frequency domain.
The obtained information in the frequency do-
main is shown in Figure 10. The position of the
crosshairs (O point) in the lower left corner is
the phase information in the frequency domain.
After the fundamental frequency is extracted by
a circular filter and moved to the center of the
Figure 6: Wrapped phase. frequency domain, the fringe intensity informa-
tion in the space domain is obtained by Fourier
is calculated according to equation 7, and the inversion. Since other operations are the same as