
Page 23 - 2024F
P. 23
16 UEC Int’l Mini-Conference No.53
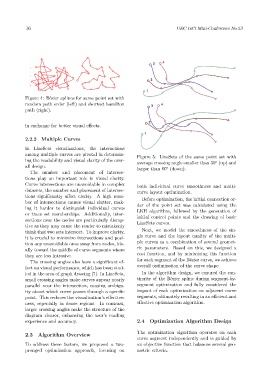
Figure 4: Bézier splines for same point set with
random path order (left) and shortest hamilton
path (right).
in exchange for better visual effects.
2.2.2 Multiple Curves
In LineSets visualizations, the interactions
among multiple curves are pivotal in determin- Figure 5: LineSets of the same point set with
ing the readability and visual clarity of the over- average crossing angle smaller than 30° (up) and
all design. larger than 60° (down).
The number and placement of intersec-
tions play an important role in visual clarity.
Curve intersections are unavoidable in complex both individual curve smoothness and multi-
datasets, the number and placement of intersec- curve layout optimization.
tions significantly affect clarity. A high num- Before optimization, the initial connection or-
ber of intersections causes visual clutter, mak- der of the point set was calculated using the
ing it harder to distinguish individual curves LKH algorithm, followed by the generation of
or trace set memberships. Additionally, inter-
sections near the nodes are particularly disrup- initial control points and the drawing of basic
tive as they may cause the reader to mistakenly LineSets curves.
think that two sets intersect. To improve clarity, Next, we model the smoothness of the sin-
it is crucial to minimize intersections and posi- gle curve and the layout quality of the multi-
tion any unavoidable ones away from nodes, ide- ple curves as a combination of several geomet-
ally toward the middle of curve segments where ric parameters. Based on this, we designed a
they are less intrusive. cost function, and by minimizing this function
The crossing angles also have a significant ef- for each segment of the Bézier curve, we achieve
fect on visual performance, which has been stud- overall optimization of the curve shape.
ied in the area of graph drawing [7]. In LineSets, In the algorithm design, we ensured the con-
small crossing angles make curves appear nearly tinuity of the Bézier spline during segment-by-
parallel near the intersection, causing ambigu- segment optimization and fully considered the
ity about which curve passes through a specific impact of each optimization on adjacent curve
point. This reduces the visualization’s effective- segments, ultimately resulting in an efficient and
ness, especially in dense regions. In contrast, effective optimization algorithm.
larger crossing angles make the structure of the
diagram clearer, enhancing the user’s reading
experience and accuracy. 2.4 Optimization Algorithm Design
The optimization algorithm operates on each
2.3 Algorithm Overview
curve segment independently and is guided by
To address these factors, we proposed a two- an objective function that balances several geo-
pronged optimization approach, focusing on metric criteria.