
Page 26 - 2024F
P. 26
UEC Int’l Mini-Conference No.53 19
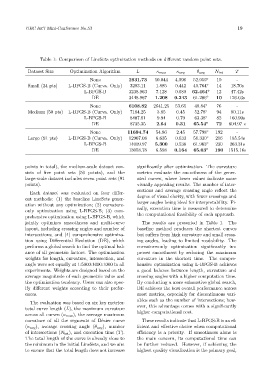
Table 1: Comparison of LineSets optimization methods on different random point sets.
Dataset Size Optimization Algorithm L κ max κ avg θ avg N int T
None 2931.73 50.044 4.996 52.959° 10 -
Small (24 pts) L-BFGS-B (Curva. Only) 3283.11 1.885 0.442 49.764° 14 18.70s
L-BFGS-B 3238.963 7.128 0.680 62.464° 12 47.42s
DE 3448.967 1.208 0.243 61.206° 10 126.03s
None 6108.82 2641.25 53.65 48.84° 76 -
Medium (50 pts) L-BFGS-B (Curva. Only) 7184.25 3.85 0.45 52.78° 94 80.11s
L-BFGS-B 8407.61 9.94 0.79 63.38° 82 160.90s
DE 8735.35 2.64 0.31 65.54° 72 604.97 s
None 11694.74 54.86 2.45 57.798° 192 -
Large (91 pts) L-BFGS-B (Curva. Only) 12967.08 6.635 0.633 56.330° 216 185.54s
L-BFGS-B 14009.97 5.300 0.538 61.963° 230 263.31s
DE 13058.78 6.598 0.164 65.03° 190 1515.16s
points in total), the medium-scale dataset con- significantly after optimization. The curvature
sists of five point sets (50 points), and the metrics evaluate the smoothness of the gener-
large-scale dataset includes seven point sets (91 ated curves, where lower values indicate more
points). visually appealing results. The number of inter-
sections and average crossing angle reflect the
Each dataset was evaluated on four differ-
ent methods: (1) the baseline LineSets gener- degree of visual clarity, with fewer crossings and
ation without any optimization; (2) curvature- larger angles being ideal for interpretability. Fi-
only optimization using L-BFGS-B; (3) com- nally, execution time is measured to determine
prehensive optimization using L-BFGS-B, which the computational feasibility of each approach.
jointly optimizes smoothness and multi-curve The results are presented in Table 1. The
layout, including crossing angles and number of baseline method produces the shortest curves
intersections; and (4) comprehensive optimiza- but suffers from high curvature and small cross-
tion using Differential Evolution (DE), which ing angles, leading to limited readability. The
performs a global search to find the optimal bal- curvature-only optimization significantly im-
ance of all geometric factors. The optimization proves smoothness by reducing the maximum
weights for length, curvature, intersection, and curvature in the shortest time. The compre-
angle were set equally at 1:5000:1000:1000 in all hensive optimization using L-BFGS-B achieves
experiments. Weights are designed based on the a good balance between length, curvature and
average magnitude of each geometric value and crossing angles with a higher computation time.
the optimization tendency. Users can also spec- By conducting a more exhaustive global search,
ify different weights according to their prefer- DE achieves the best overall performance across
ences. most metrics, especially for discontinuous vari-
ables such as the number of intersections; how-
The evaluation was based on six key metrics:
total curve length (L), the maximum curvature ever, this advantage comes with a significantly
across all curves (κ max ), the average maximum higher computational cost.
curvature of all the segments of Bézier curve These results indicate that L-BFGS-B is an ef-
(κ avg ), average crossing angle (θ avg ), number ficient and effective choice when computational
of intersections (N int ), and execution time (T). efficiency is a priority. If smoothness alone is
The total length of the curve is already close to the main concern, its computational time can
the minimum in the initial LineSets, and we aim be further reduced. However, if achieving the
to ensure that the total length does not increase highest quality visualization is the primary goal,