
Page 28 - 2024F
P. 28
UEC Int’l Mini-Conference No.53 21
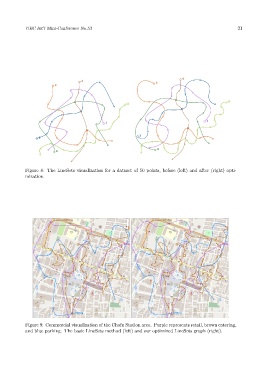
Figure 8: The LineSets visualization for a dataset of 50 points, before (left) and after (right) opti-
mization.
Figure 9: Commercial visualization of the Chōfu Station area. Purple represents retail, brown catering,
and blue parking. The basic LineSets method (left) and our optimized LineSets graph (right).