
Page 28 - 2024S
P. 28
UEC Int’l Mini-Conference No.52 21
the upper and lower bounds of a storage, it is as- be followed.
sumed that |P min | = P max and |Q min | = Q max .
The upper and lower bounds of the DERs con-
nected to the bus are shown in Table 2, as well
as the time constants of each of the devices.
The fmincon function of Matlab is used with
interior-point as optimizer.
4.1 Flexibility Region Attack
The enlarging attack is performed by multiply-
ing a factor of 1.2 to the upper and lower bounds
of the storage connected to the bus. The refer-
ence signals were chosen so that the cardinality
of the set REF is small, which is obtained by
reference signals near the hull of the flexibility
region. In Figure 3, the trajectory of the ac-
tive and reactive power of the bus is mapped in
the P, Q-space, as well as the hull of the flexibil-
ity region without the attacked storage and the
hull with the attacked storage. The crosses mark
the reference signals of the SPC controller. The
trajectories are inside the unattacked flexibility
region as well as the chosen reference signals.
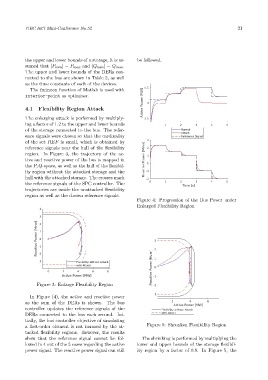
Figure 4: Progression of the Bus Power under
Enlarged Flexibility Region
Figure 3: Enlarge Flexibility Region
In Figure (4), the active and reactive power
as the sum of the DERs is shown. The bus
controller updates the reference signals of the
DERs connected to the bus each second. Ini-
tially, the bus controller objective of simulating
a first-order element is not harmed by the at- Figure 5: Shrunken Flexibility Region
tacked flexibility regions. However, the results
show that the reference signal cannot be fol- The shrinking is performed by multiplying the
lowed in 4 out of the 5 cases regarding the active lower and upper bounds of the storage flexibil-
power signal. The reactive power signal can still ity region by a factor of 0.8. In Figure 5, the