
Page 29 - 2024S
P. 29
22 UEC Int’l Mini-Conference No.52
hull of the flexibility region in the P, Q plane
is shown, as well as the trajectory of the power
progressions. Two reference signals lie outside
the attacked flexibility region and two on the
hull of the region.
The temporal progression of the summed ac-
tive power and reactive power of the DERs, with
a shrunken flexibility region, is shown in Figure
6. The reference signals that are outside the
shrunken region cannot be followed for both the
active and reactive power. The reference signals
inside the region can be followed, and the first-
order behavior is obtained.
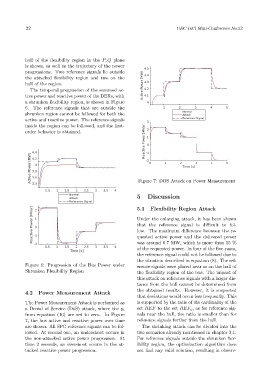
Figure 7: DOS Attack on Power Measurement
5 Discussion
5.1 Flexibility Region Attack
Under the enlarging attack, it has been shown
that the reference signal is difficult to fol-
low. The maximum difference between the re-
quested active power and the delivered power
was around 0.7 MW, which is more than 15 %
of the requested power. In four of the five cases,
the reference signal could not be followed due to
the situation described in equation (8). The ref-
Figure 6: Progression of the Bus Power under erence signals were placed near or on the hull of
Shrunken Flexibility Region the flexibility region of the bus. The impact of
this attack on reference signals with a larger dis-
tance from the hull cannot be determined from
the obtained results. However, it is suspected
4.2 Power Measurement Attack
that deviations would occur less frequently. This
The Power Measurement Attack is performed as is supported by the ratio of the cardinality of the
set REF to the set REF a , as for reference sig-
a Denial of Service (DoS) attack, where the y i
from equation (10) are set to zero. In Figure nals near the hull, the ratio is smaller than for
7, the bus active and reactive power over time reference signals further from the hull.
are shown. All SPC reference signals can be fol- The shrinking attack can be divided into the
lowed. At second one, an undershoot occurs in two scenarios already mentioned in chapter 3.1.
the non-attacked active power progression. At For reference signals outside the shrunken flex-
time 2 seconds, an overshoot occurs in the at- ibility region, the optimization algorithm does
tacked reactive power progression. not find any valid solution, resulting in observ-